
Ellipsoids Properties: General
To access this screen:
- In the Ellipsoids Properties screen, click the General tab.
Use the Ellipsoids Properties: General screen to define how the target ellipsoid data overlay is displayed in the 3D window.
This screen relates to the presentation of the ellipsoids data type, which are similar to points data but with additional attributes to specify axes dimensions and orientation.
Note: legacy ellipsoids data, as produced by the ELLIPSE process, is formatted as wireframe data.
To configure an ellipsoids data object's overlay:
-
Review the Name of the overlay. You can edit this name, which will not affect the description assigned to the underlying data file or object. This is the same as using the Sheets control bar menu's Rename option.
-
Review the Source object name. This can't be edited.
-
Set the Color of the ellipsoid. By default, the standard COLOUR Legend is applied.
-
You can set your ellipsoid data to be a Fixed colour. All ellipsoids of the target overlay are rendered using this colour.
-
Colouring an ellipsoid using a Legend allows you to conditionally colour the ellipsoid data of the target overlay by matching Column values to a defined display legend.
-
Specify 3 numeric data attributes that represent the RGB colours to display for each ellipsoid on display. Each ellipsoid will have a single colour.
-
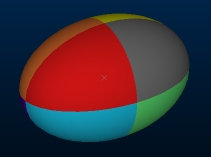
Show each of the ellipsoid Octants in distinct colours, like this:
-
-
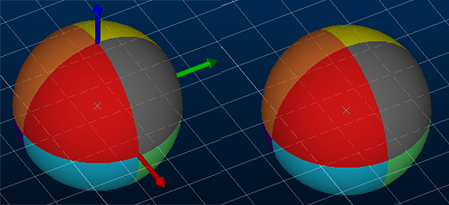
Choose if you wish to Display axis Indicators or not, on all ellipsoids within the target object. In the image below, for example, indicators are enabled for the left image and disabled for the right:
-
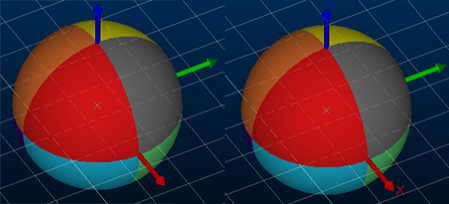
Choose whether to Display axis labels. This option is only available if Display axis indicators is enabled (see above). These axis labels indicate which arrow represents X, Y and Z.
-
Set the Size of the labels of the axis indicators.
-
Adjust the Opacity of the ellipsoids of the target overlay by dragging the slider to the right to increase opacity, or to the left for increased transparency.
-
Click OK or Apply to update the ellipsoid overlay display in 3D windows.
Related topics and activities